Break-even point and how to calculate it? What is the break-even point and its calculation? How to find the break-even point in physical terms.
Calculating such an indicator is important for almost any enterprise. Does it sell finished products or produce its own? After all, it is necessary to know when an open enterprise or store will recoup the money invested in it and begin to make a profit.
What is the break-even point and what does it show?
This indicator is important not only for the enterprise, but also for potential investors. After all, they first of all look at this indicator, since it is important to determine when the enterprise will begin to generate income and thereby indicate its attractiveness in investment terms. So this indicator significantly influences the decision to invest financial assets.
The break-even point shows the volume of product sales at which profit is equal to the cost of the product. Profit is determined by the difference in costs and revenue per unit of production.
The break-even point indicator is determined in monetary terms and in physical terms. By considering the value of this indicator, you can understand how much it will be necessary to produce products, provide services, or fulfill orders in order to cover initial costs and make zero profit. So the break-even point as a result reflects how income compares with expenses.
When this point is exceeded, the company receives a profit, and if it does not reach it, it receives fixed costs.
T.B. indicator company is necessary to determine the financial stability of the enterprise. For example, if this indicator is constantly increasing, then this is a clear signal that the company is having problems making a profit. We should not forget that T.B. may change as production or trade turnover expands. Basically, with such indicators it decreases.
To summarize, calculating such an indicator provides the following opportunities:
- Decide whether it is worth investing your money in this project if its payback occurs after the release of several batches of products;
- Identify possible problems at the enterprise associated with constant changes in technical requirements;
- You can find out the dependence of sales volume on the price of products. In this way, you can calculate how much to reduce or increase sales volume depending on price changes;
- Calculate by what acceptable value it is necessary to reduce profit in order not to end up at a loss.
In addition, in large manufacturing enterprises this indicator serves as the main criterion for pricing its products. This indicator is also taken into account when deciding to introduce discounts on products.
T.B. it is also necessary to indicate in the business plans being developed about the opening of a new production facility or retail outlet.
Break-even point - how to calculate?
Before you begin calculating your break-even point, you will first need to consider your business's costs. They will need to be distributed between constants and variables. This action will affect the accuracy of subsequent calculations.
The constants include:
- Depreciation expenses (included in the cost of the product itself);
- Salaries of administration personnel (with all deductions and payments);
- Rent;
- Purchase of raw materials.
Variables include:
- Purchase and repair of components;
- Fuel and other combustible materials necessary to support the production process;
- Salaries of main workers.

Note that fixed costs cannot depend on the amount of volume and sales. In addition, these expenses will not change much over time. In order for them to change, the following points must be changed:
- Increase or decrease in production at the enterprise;
- Opening or closing of an additional department, workshop, production line;
- Increase or decrease in rent;
- High inflation.
However, they may not change at all with an increase in the volume of production. Therefore, such costs are attributed as temporarily constant per unit of goods produced.
Calculation formula
This indicator is calculated using the following formula:
T.B.=Pos.Z.? (Doh. -Per. Z.)
- T.B. - break even;
- Pos. Z. – Fixed costs;
- Ext. – Income;
- Per. Z. – Variable costs.
Using the data obtained as a result of calculation using this formula, you can obtain indicators of the critical sales volume in numerical values.
To calculate this indicator in financial terms, you must have the following expressions in the data:
- Pos. Z. – fixed costs;
- Ext. – Income;
- Per. Z. – variable costs.
To calculate this indicator in monetary format, you will need to calculate the marginal income. Contribution margin is the difference between income and variable costs. It is determined by the following formula:
M=Doh. -Per. Z.
The marginal income ratio we need is calculated using the following formula:
After calculating this indicator, you can finally begin to calculate T.B. in monetary format:
T.B. den.=Pos. Z.?KM
Using this formula, you will get the value at which your revenue will cover the costs of production needs.
In order to better understand this material, it is better to consider this indicator using an example.
Examples of break-even point calculations
For the first example, it is best to consider a clothing store, because thanks to its work, T.B. for him it is calculated only in the financial version.
For a clothing store located in a shopping center, the following items can be included in fixed expenses:
- Renting premises;
- Employee salaries;
- Insurance contributions from salary;
- Payment of utility services;
- Payment for advertising campaigns.
Our example shows that fixed costs in this store will be equal to 336,000 rubles. And his income will be about 2,300,000 rubles. So, let's calculate the marginal income:
KM =1800000?2300000= 0.78 rub.
T.B. den.=336000?0.78=430769 rub.
This indicator tells us that the store will need to sell its products in the amount of 430,769 rubles in order to achieve self-sufficiency. We can also find out that this store has a so-called capital reserve; this indicator tells how much you can reduce your income so as not to go into constant expenses.
Let's look at the second example against the backdrop of a manufacturing plant.
Basically, all enterprises that produce their products are designed to create only one type of product. Thanks to this, their costs are the most optimal. At the same time, T.B. is calculated numerically for this type of product.
The price of one produced product is 350 rubles
Let's calculate T.B. for the enterprise using the initial data:
T.B. =265000?350-280=3785
This value means how many units of product the company needs to produce in order for its costs to reach zero. If the output is large, the enterprise will begin to make its profit.
This indicator as a whole is an important criterion for further planning of possible volumes of production or sales of goods. In addition, this value gives an understanding of how large the difference is between expenses and income per unit of production. With the help of which you can better control changes in price formations.
In addition, this indicator is of paramount importance for investors, since it is by this indicator that they judge the attractiveness of investing in an idea or company.
In contact with
To develop any type of business, it is important to understand at what point, at what volume of production or sales, the enterprise will be able to fully cover all costs, losses and begin to make a profit.
This level can be determined by the procedure for calculating the break-even point - the most important indicator of the effectiveness of any commercial project. The higher the volume of production and sales above this critical level, the more stable the financial position of the enterprise.
Characteristics and main indicators
The break-even point is a value indicating the required volume of production or sales for the stable operation of an enterprise without making losses or profits.
 Upon reaching this point the number of costs will be equal to the cost volume of sales, that is, both income and expenses will be at zero. Sometimes this parameter is called the critical production volume, threshold. In this situation, the company does not make a profit and is only able to recover costs.
At the same time, the break-even rate makes it possible to calculate, how many products need to be produced or sold so as not to be “in the red” and work with a profit. There is such a thing here addiction: if this indicator is exceeded, the organization makes a profit; if it has not yet been passed, then the production is unprofitable. This indicator responds to many factors: changes in prices for raw materials, materials, increase in turnover, expansion of the dealer network, etc.
The break-even point is paramount for determining the financial stability of the company, since allows:
- see the trend in business development as a whole;
- assess the attractiveness of an investment project for potential investors: payback period, level of risk, etc.;
- identify problems in the enterprise if this parameter changes over time;
- plan sales for a certain period;
- understand the ratio of income and costs in order to adjust prices, see where costs can be reduced;
- calculate how much it is necessary to change the volume when the price changes and vice versa; By what amount should you reduce revenue so as not to fall into a loss?
Calculation algorithm
To determine this point you need variable and fixed cost data. They must be correctly separated and the difference between them must be understood. Successful entrepreneurship requires proper calculation of all costs of running a business.
Variable costs may consist of expenses for raw materials, materials, semi-finished products, components, energy, fuel for production, as well as the amount of all key employees along with other things.
There are practically impossible to calculate in advance : they depend on the nature of the enterprise’s activities, production volume and can change monthly. The greater the volume of production and sales, the higher the amount of costs. Average variable costs do not change with production volume.
IN fixed costs may include rental fees, deductions for depreciation, the amount of wages of administrative and management personnel along with insurance contributions, payments for taxes, communications costs, etc.
Such costs remain constant and do not depend on production volume. However, they may be influenced by changes in enterprise capacity, changing rent amounts, inflation, etc.
Step by step definition and application mechanism The break-even point can be represented as follows:
- Collection of data to analyze the level of production volume, sales of goods, expenses and income;
- Calculation of the size of all costs, break-even point and safety area;
- Assessment of the required level of production/sales for the financial stability of the company.
Calculation algorithm The break-even point could be:
- analytical (using special formulas);
- graphical (involves building a graph based on a number of basic values).
If you have not yet registered an organization, then easiest way This can be done using online services that will help you generate all the necessary documents for free: If you already have an organization and you are thinking about how to simplify and automate accounting and reporting, then the following online services will come to the rescue and will completely replace an accountant at your enterprise and will save a lot of money and time. All reporting is generated automatically, signed electronically and sent automatically online. It is ideal for individual entrepreneurs or LLCs on the simplified tax system, UTII, PSN, TS, OSNO.
Everything happens in a few clicks, without queues and stress. Try it and you will be surprised how easy it has become!
Calculation formula
 To measure the break-even point, the following are taken: indicators:
- Revenue (income).
- Costs are constant (per volume).
- Variable costs (per volume).
- Average variable costs (per unit of production).
- Price (revenue per unit of production).
- Marginal income (the difference between revenue and variable costs).
- Margin ratio (the share of marginal income in revenue, determined by dividing the costs of variables by the amount of revenue).
Calculation formula in monetary equivalent:
Break-even point = Revenue Fixed costs / (Revenue – Variable costs)
Calculation formula in in kind:
Break-even point = Fixed costs / (Price – Average variable costs)
There is also a method for determining the break-even point in monetary terms using the value marginal income:
Break-even point = Fixed costs / Margin ratio
The result of the calculation using the formulas will be the critical volume of production or sales in monetary or physical terms. Since the break-even point shows the sales volume from which profit comes, comparing it with other indicators (such as cost, expenses, etc.), it can be used to analyze an investment project.
What are fixed and variable costs, as well as the break-even point, see the following video lesson:
Calculation example
Clothing store
Let's calculate the break-even point for a workwear store. Here it is better to apply the calculation in monetary terms, because the range of goods and prices are different.
Initial data:
- Fixed costs (rent, salespersons' wages together with deductions, payment for utilities and advertising) = 250,000 rubles.
- Average purchase price of the product = 1000 rubles.
- Sales volume = 300 units.
- Variable costs (purchase prices of products) = 300,000 rubles.
- Revenue = 600,000 rubles.
- Marginal income = Revenue – Variable costs = 600,000 – 300,000 = 300,000 rubles.
Margin ratio = Variable costs / Revenue = 0.5.
Calculation:
Break-even point = Revenue Fixed costs / (Revenue – Variable costs) = 600,000 250,000 / (600,000 – 300,000) = 500,000 rubles.
Or according to another formula:
Break-even point = Fixed costs / Margin ratio = 250,000 / 0.5 = 500,000 rubles.
Thus, the store needs to sell goods worth 500,000 rubles to cover expenses and break even. All sales above will be profitable.
For a metalworking enterprise
 When calculating the break-even point for a metalworking enterprise, it is better to use the formula in in kind. Small businesses often produce disposable products at approximately the same prices.
Original data:
- Fixed costs (total expenses for the enterprise, deductions for depreciation, the amount of administration salaries together with deductions) = 250,000 rubles.
- Variable costs (funds for the purchase of raw materials and semi-finished products, the amount of wages of working personnel along with deductions, fuel and technological costs) = 300,000 rubles.
- Average variable costs (per unit of production) = 300 rubles.
- Product price (revenue per unit of production) = 500 rubles.
- Production volume (planned) = 1000 units.
- Revenue = 500,000 rubles.
Calculation:
Break-even point = Fixed costs / (Price – Average variable costs) = 250,000 / (500 – 300) = 1250 pieces.
Thus, the enterprise will achieve break-even point for a production volume of 1,250 units over a certain period. This example shows that to reach a level without losses and profits, you need to increase the volume of production by 250 pieces from the planned one. Further excess volume will bring profit.
However, the default calculation recognizes the fact that if the volume increases, the price will remain the same, costs will not increase, and the product will be sold in full, without any leftovers. In reality, not everything can be so perfect.
An example of the calculation can be studied in this video:
Algorithm for constructing a graph
When constructing this graph it is necessary do the following:
- on the horizontal axis indicate the volume of production/sales;
- On the vertical axis, plot the values of fixed costs (straight line), variable costs (oblique line) and gross costs separately, as well as revenue.
As a result, graphs of fixed, variable and gross costs, as well as revenue, will be built. Break even located at the intersection graphs of revenue and gross costs. At this point, revenue and sales volume are threshold or critical, the company covers all costs and makes zero profit.

Plotting the break-even point
Break-even point chart reflects change in revenue, fixed, variable and gross costs depending on production volumes indicated on a horizontal percentage scale.
When constructing it, the assumption is made that sales occur evenly, prices for products and raw materials do not change over the period taken.
Advantages and disadvantages of this analysis model
 Any beginning entrepreneur should calculate the break-even point. This model allows you to easily see the lower limit of the financial stability of a business project in order to take steps to increase the safety zone (distance from the critical zero profit mark). The mechanism for finding the threshold level of production and sales is quite simple and does not require any additional special knowledge.
However, it should be borne in mind that to determine this point, ideal conditions of production, market and labor organization are taken. In everyday reality, the production of products and their sales are influenced by many external factors that are difficult to predict. In particular, seasonality, fluctuations in demand, increased competition, the introduction of new technologies, and increased prices for raw materials are important, which can change sales volumes. Therefore, this model is more suitable for enterprises operating in stable market conditions.
Many companies use various analytical techniques, including those borrowed from abroad, to manage their income and costs. Among them, the simplest and most common is CVP analysis, which involves estimating the break-even point. By learning to make simple calculations, you can get an effective financial management system with elements of strategic planning.
Break even
Break-even point (BEP)– sales volume at which the entrepreneur’s profit is zero. Profit is the difference between income (TR – total revenue) and expenses (TC – total cost). It is measured in physical or monetary terms. It helps determine how many products need to be sold (services performed) to cover expenses. At the break-even point, revenues cover expenses. If it is exceeded, the company makes a profit; if it is not achieved, the company incurs losses.
Dear reader! Our articles talk about typical ways to resolve legal issues, but each case is unique.
If you want to know how to solve exactly your problem - contact the online consultant form on the right or call by phone.
It's fast and free!
It represents a mathematical and graphical assessment of the relationship between three main components:
- WITH– enterprise costs.
- Q– quantity of products sold (in natural units).
- Pr- profit.
All calculations are made with the aim of:
- determine the physical and cost volume of sales, which will allow not only to compensate, but also to obtain the desired profit;
- predict what profit can be obtained if the sales volume is known;
- assess how profit will react to changes in price, costs or quantity of goods;
- establish the optimal structure for this type of activity.

Where to start?
You must first decide which costs are fixed and which are variable, since they are mandatory components for the calculation.
The main condition for conducting CVP analysis is the division of all enterprise costs into two groups:
Variables(VC – Variable Cost) – costs, the volume of which changes in proportion to the increase (decrease) in production volume. That is, the more products you need to produce, the more you will have to spend, and vice versa. These usually include raw materials and supplies, semi-finished products, workers’ wages, fuel and electricity for technological purposes, packaging, etc.
The average variables are calculated separately ( AVWITH– Average Variable Cost), which show the size of VC per unit of production. Over time, their size does not change.
Permanent(FC - Fixed Cost) - costs, the change of which does not directly depend on the growth and decline in production volumes. These are, as a rule, the costs of maintaining administrative personnel, utility bills, communications, depreciation, etc. All these costs will occur even if the company cannot produce or sell anything. In this sense, they are conditionally constant.
Calculation formula
Break-even point is calculated in two dimensions:
In natural units:
VERNAT = FC / (P – AVC) = FC x Q / (TP – VC)
Where P is the price.
This determines the minimum acceptable sales volume in physical units of weight, length, volume or quantity.
In monetary units:
VERDEN = VERNAT x P
This determines the amount of revenue that will cover and make zero profit.
There is another method for calculating BER in monetary terms. But for this you need to use the indicator marginal income/profit (MR– Marginal Profit). It characterizes the part of the proceeds that will remain after financing variable costs and will be subsequently used to cover fixed costs and make a profit.
MP = TP – VC = FC + Pr
Average contribution margin will be calculated like this:
AMP = MP / Q = P – AVC
Marginal income ratio – This is the share of marginal income in the company's revenue. It shows how many kopecks of profit each additional ruble of revenue will bring.
K MP = MP / TP = AMP / P
Then to calculate the break-even point in monetary terms you can use the formula:
BEP = FC / K MP
The need for calculation
Break-even analysis – an important source of information for making decisions regarding business activity:
- Should you invest in a specific project? For an entrepreneur, it is important not to “burn out” and it is important to know from what point the risk of financial failure will decrease. Based on the BER indicator, you can calculate the volume of sales, starting from which a new business will begin to make a profit, and investments will pay off.
- What does the change in BELIEVES over time indicate? Expansion and contraction of activities directly affects the level of the critical point. The larger the size of the company, the higher its VER. But if the volume of activity has not changed, and the profitability threshold has become higher, this may signal problems. Something goes wrong if you have to sell more than before to make a profit.
- Change price or sales volume? The BEP indicator contains a linear relationship between the price and quantity of goods intended for sale. On this basis, a strategic decision is made: if the selling price changes, how much should the sales volume be changed in order not to lose profit? And vice versa, how should the pricing policy be adjusted in the face of changes in the scale of sales?
- How much can you afford to reduce revenue and still break even? The BER indicator is used when calculating the financial safety margin ( MFS– Margin of financial safety), which directly answers the question posed.
MFS = (TP – BEP) / TP x 100
MFS is determined as a percentage and allows you to compare different enterprises with each other. This coefficient is a kind of airbag. The higher it is, the better the company’s financial position is protected from any negative changes in the market.
Calculation examples
Although all enterprises use the same formulas for calculating BEP, the industry and type of activity influence the composition of costs, as well as their division into VC and FC.
For the store
Trading enterprises have a wide range of products with different price characteristics, so it is physically impossible to calculate the critical volume for each type of product. It is more expedient to calculate the VER for the outlet as a whole. To do this, we conditionally divide costs into variable and fixed.
By selling goods worth more than 1,012,500 rubles, the store will make a profit, and revenue below this level will plunge the outlet into losses. In this state of affairs, each additional ruble of revenue brings 40 kopecks of profit.
For enterprise
Manufacturing enterprises that specialize in the production of homogeneous products can calculate the critical point in both natural and monetary units.
Indicator Amount
Sales volume, pcs. 10,000
Sales price, rub. 150
Revenues from sales(p.1 x p.2) 1 500 000
Variables: 1 000 000
Raw materials and supplies 800,000
Salary of main workers with deductions 100,000
Electricity for technological purposes 40,000
General production expenses 60,000
Average variable costs (p. 4 / p. 1) 100
Marginal income(p.3 – p.4) 500 000
Fixed costs: 187 000
Factory overhead costs 62,000
Depreciation and repair of equipment 25,000
Utility bills (gas, electricity, water, electricity) 30,000
Salary of management and maintenance personnel with deductions 70 00
Profit(p.6 – p.7) 313 000
Break-even point in natural units(p. 7 / (p. 5 – p. 2)) 3 740
Break-even point in monetary units(p. 9 x p. 2) 561 000
At this enterprise, making a profit is possible already from a sales volume of 3,740 units or 561,000 rubles.
Certain assumptions when calculating
The calculation is simple and universal, but has its own conditional limitations (assumptions):
- the selling price does not increase with an increase in the volume of units sold;
- costs remain unchanged;
- Products are sold completely (without any leftovers in the warehouse or in production) in one operating cycle;
- VER calculation is made for one type of product for which the cost can be determined.
Limitations make the BER indicator not an absolute, but a conditional indicator and causes criticism from many analysts.
VER schedule
An important method of analysis is visual, which involves constructing a break-even chart.
Since BER is the level of activity at which income is equal to costs, the break-even point on the graph is formed at the intersection of two graphs: income (TR) and total costs (TC). The projection on the Q axis will show the size of BER in physical terms, and on the TP axis - BEP in monetary terms.
Since there are fixed costs even with zero sales volume, the TC schedule starts from a point equal to the size of FC.
Sequence of plotting:
- An income graph is being built: the first point is at 0, and the second is at the intersection of sales volume in physical units and the amount of revenue.
- A cost schedule is constructed: the first point on the vertical axis is at the level of fixed costs, and the second at the intersection of sales volume in physical units and total (fixed and variable) costs.
- At the intersection of the graphs, VER is marked, as well as the profit and loss area.
CVP analysis is a methodology that is easy to understand and apply, which will enable entrepreneurs to control current costs, plan prices and volume of activities that ensure profit. Only by understanding the relationship between the main indicators can you learn to manage them.
Determining the break-even point is the cornerstone of the effective functioning of any enterprise. The calculation of this indicator is of paramount importance not only for the owners of the enterprise, but also for its investors. If the former must understand when production becomes profitable, then the latter must be aware of the value of this indicator in order to make an informed decision about providing financing.
What is the break-even point and what does it show?
This indicator helps to understand when a company stops incurring losses, but is not yet able to earn a profit. At the same time, the production and sale of any additional unit of production entails the formation of profit. Thus, the break-even point is a certain starting point from which the enterprise can begin to develop effectively. Those. this indicator is a kind of indicator that the company is moving on the right path.
This indicator is also called profitability threshold or simply BEP(from English break-evenpoint). It characterizes the volume of production of a product at which the proceeds from its sale will be equal to the costs of its production.
What is the economic meaning of determining the value of this indicator? The profitability threshold indicates the enterprise's ability to recoup its costs.
The break-even point occurs when expenses are covered by income. The company records profit when this indicator is exceeded. If this indicator is not achieved, then the company suffers losses.
So, the break-even point shows:
- the level above which the company begins to record profits;
- the minimum acceptable level of revenue, if below which the production of products ceases to pay off;
- the minimum acceptable level of pricing, below which one cannot fall.
In addition, the determination of this indicator allows:
- identify problems that are associated with changes in the break-even point over time;
- identify how it should be possible to change the volume of output of a product or its production when the price varies;
- calculate how much it is advisable to reduce revenue so as not to incur losses.
Determining the profitability threshold helps investors determine whether a given project is worth financing if it breaks even for a given sales volume.
Video - break-even point analysis:
Thus, most management decisions are made only after the break-even point has been calculated. This indicator helps in calculating the critical value of sales volume at which the company's costs become equal to revenue from sales of goods. Even a slight decrease in this indicator will indicate the beginning of bankruptcy of the company.
Important! When the company crosses the break-even point, it will begin to record profits. Until then, it operates at a loss.
Calculation formulas
The profitability threshold can be measured in physical or monetary terms.
In both cases, to determine the profitability threshold, it is important to first calculate the costs of the enterprise. To do this, we introduce the concept of fixed and variable costs.
Fixed costs do not change over time and are not directly dependent on sales volume. However, they can also change under the influence of, for example, the following factors:
- changes in company performance;
- expansion of production;
- changes in rental prices;
- changes in general economic conditions, etc.
These typically include the following costs:
- payment of management expenses;
- rent;
- depreciation deductions.
Variable costs are a more unstable value, which depends on changes in production volume. This type of cost includes:
- payment of wages and other deductions to workers;
- costs of raw materials and the purchase of necessary materials;
- purchase of components and semi-finished products;
- energy payment.
Accordingly, the amount of variable costs will be higher, the greater the production volume and sales volume.
Variable costs per unit of manufactured goods do not change when the volume of its production changes! They are conditionally permanent.
Having defined the concept and types of costs, let’s find out how to calculate the break-even point (BEP) in kind. To do this we use the following formula:
BEP (in physical terms) = fixed costs / (unit selling price - variable costs per unit)
It is advisable to use this formula when the enterprise is engaged only in the production of one type of product. However, this is extremely rare. If an enterprise produces a wide range of products, then indicators for each type are calculated separately using a special extended formula.
When calculating the break-even point in monetary terms another formula is used:
BEP (in monetary terms) = (fixed costs / marginal profit) * revenue from product sales
For correct calculations, we use actual data on costs and revenue for the analyzed period. In this case, indicators that relate to the same analysis period should be used.
However, the use of this formula is correct when determining BEP with marginal profit, which is positive. If it is negative, then the BEP value is determined as the sum of fixed and variable costs that are relevant to a given period.
Video about the importance of determining the profitability threshold in business:
Or you can use another formula for calculating the profitability threshold:
BEP (in monetary terms) = Fixed costs / KMD,
where KMD is the marginal profit coefficient.
In this case, the KMR can be determined by dividing the MR (marginal income) by revenue or price. In turn, MD is obtained using one of the following formulas:
MD = V - PZO,
where B is revenue,
VZO – variable costs for sales volume.
MD = C - PZE,
where C is the price,
PZE – variable costs per unit of goods.
Calculation examples
For greater clarity, let’s look at examples of calculating the break-even point using the example of an enterprise and a store.
For an industrial enterprise
Let's say the following conditions are given. The company produces one type of product. At the same time, the cost per unit of production is 50,000 rubles. Price – 100,000 rubles. Fixed costs - 200,000 rubles. It is necessary to calculate the minimum volume of goods produced at which the enterprise will reach the profitability threshold. Those. we need to calculate the BEP in physical terms. We use the above formula and get:
BEP (in physical terms) = 200,000/(100,000-50,000) = 40 (product units).
Conclusion: thus, when producing at least 40 units of product, the enterprise will reach the break-even point. An increase in the volume of products produced by the enterprise will lead to profit.
For the store
In the following example, we will calculate the break-even point for a store. Let's assume that the store is a grocery store and has the following fixed costs (in rubles):
- rent of space – 80,000;
- salaries of managers – 60,000;
- insurance premiums – 18,000;
- utility bills - 10,000.
Total: 168,000 (rubles).
The conditions also give the values of the cost variables:
- energy payment – 5,000;
- raw material costs – 10,000.
- Total: 15,000 (rubles).
Let’s assume that the amount of revenue is 800,000 rubles. Let's define BEP in cost terms. First, let's calculate the marginal profit. To do this, subtract variable costs from revenue and get 800,000 – 15,000 = 785,000. Then the KMD will be 785,000 / 800,000 = 0.98.
Then the break-even point will be equal to fixed costs divided by the resulting coefficient, or 168,000/0.98 = 171,429 rubles.
Conclusion: Thus, the store must sell goods worth 171,429 rubles in order for income to be greater than expenses. All subsequent sales will bring net profit to the store.
Schedule
In order to find the profitability threshold, you can use the graphical method of calculating this indicator. To do this, we will display on the graph fixed and variable costs, as well as total (gross) costs. The break-even point graphically corresponds to the point of intersection of the gross revenue and total cost curves.

Let's look at this with an example.
The following conditions are given (in rubles):
- revenue amount – 100,000;
- production output – 100 (pieces);
- fixed costs – 25,000;
- variable costs – 30,000.

Having marked these data on the graph, we get the following conclusion: the enterprise will be at the break-even point when it receives income in the amount of 35,700 rubles. Thus, if an enterprise sells goods in quantities of more than 35 units, then it will record a profit.
Calculating the break-even point using formulas in Excel
It is very easy and convenient to calculate the profitability threshold using Excel - to do this, you just need to enter the initial data into the appropriate table, after which, using programmed formulas, we will obtain the value of the profitability threshold for our case, both in monetary and in kind terms.
You can download the calculation of the break-even point in Excel for a manufacturing enterprise specializing in the production of parts in the engineering industry at.
The graph and formula for calculating the break-even point in Excel for the general case are given
We will tell you about the break-even point of an enterprise, the formula and algorithm for calculating it in analytical and graphical form.
Enterprise break-even point(English CVP point) shows what the volume of production of goods and services, as well as their sales, should be in order to cover all costs and expenses. The break-even point can be expressed in the number of products produced, in monetary terms, or in the possible amount of future profit.
The break-even point indicator, like any financial indicator, should have an economic meaning. Thus, the break-even point serves as an indicator that shows what size of production of goods/services is critical for the enterprise, at which profits and losses are equal to zero. The break-even point is used to analyze the financial condition of an enterprise; the higher the production and sales volume above this critical point, the better its solvency and financial strength.
Model for calculating the break-even point of an enterprise
When calculating the break-even point, enterprises use the following assumptions and simplifications of reality:
- Product output and costs have a linear relationship (have a linear trend of change);
- Variable costs and product prices are constant over the future period under consideration;
- Production capacities are constant, the structure of products does not change;
- Inventories of finished products are not significant and will not distort the assessment of the enterprise’s break-even point. In other words, production equals sales;
- Variable costs can be predicted and accurately estimated in the future;
As we can see, the conditions for assessing the break-even point are ideal: stable market, production and organizational conditions. In reality, product output, sales and costs are influenced by many external factors that are difficult to predict in the planning period. Still, let’s consider an ideal model for calculating the break-even point of an enterprise.
Stages of calculating the break-even point according to A.D. Sheremet
Domestic economist A.D. Sheremet identified the main 3 stages to determine the break-even point of an enterprise.
- Collection of necessary information for analysis. Assessment of the level of production volume, product sales, profits and losses.
- Calculation of the size of variable and fixed costs, determination of the break-even point and safety zone.
- Assessing the required level of sales/production to ensure the financial sustainability of the enterprise.
The enterprise's task is to determine the lower limit of its financial stability and create opportunities to increase its safety zone.
Break even. 2 calculation formulas
Below are the formulas for calculating the break-even point of an enterprise. As a rule, they use the break-even point expressed in the volume of production and the monetary equivalent of the generated income.
Formula for calculating the break-even point of an enterprise in monetary terms
It should be noted that variable costs are calculated per unit of output, and not total.
Formula for calculating the break-even point of an enterprise in physical terms
Example of calculating the break-even point in Excel
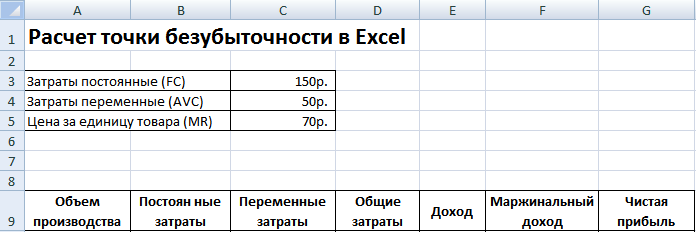
Fixed costs (FC)- These are costs that do not depend on production. For example, this could be rent for premises, leasing payments, taxes, salaries for administrative staff, etc.
Variable costs (AVC)- These are costs that vary depending on the volume of production. Variable costs include: costs of raw materials and supplies, energy payments, fuel, workers' wages, etc.
Unit price (MR)– represents the selling price of manufactured products.
Let's fill in the main indicators in Excel. Fixed costs are 150 rubles, variable costs are 50 rubles. and the selling price is 70 rubles. per unit of production.

Break even. Main settings
At the next step, we will calculate how the amount of net profit will change depending on production, and determine at what volume of product sales the break-even point will occur. Let's create a table with the following columns.
Column fixed costs= C3
Variable costs=A10*$C$4
Total costs = Variable + fixed costs= B10+C10
Income= A10*$C$5
Marginal income = Revenue - Variable costs = E10-C10
Net profit=E10-C10-B10

As we can see, starting from the 8th product, net profit became positive, and on the 7th product it was still negative. The break-even point is equal to a production volume of 8 pcs. and sales income of 560 rubles.
 |
★ (calculation of Sharpe, Sortino, Treynor, Kalmar, Modiglanca beta, VaR) + forecasting course movements |
For greater clarity, we present a graph of changes in the net profit of the enterprise depending on the volume of production/sales of products.

You can calculate and compare other calculated indicators, which are presented in the figure below. If the level of production/sales at the enterprise currently corresponds to 17 pcs. per month, the safety margin is 190 rubles.

Break-even point and practice of using it
Break-even point analysis is used for various purposes. Let's consider some directions and purposes of using this indicator. The table below shows the purposes of possible use of the break-even point indicator in economic practice.
| Users | Purpose of use |
|
Internal users |
|
| Development/Sales Director | Calculation of the optimal price per unit of goods, calculation of the level of costs when the enterprise can still be competitive. Calculation and preparation of a sales plan |
| Owners/Shareholders | Determining the volume of production at which the enterprise will become profitable |
| Financial analyst | Analysis of the financial condition of the enterprise and the level of its solvency. The further an enterprise is from the break-even point, the higher its threshold of financial reliability |
| Production Director | Determination of the minimum required volume of production at the enterprise |
|
External users |
|
| Creditors | Assessment of the level of financial reliability and solvency of the enterprise |
| Investors | Assessing the effectiveness of enterprise development |
| State | Assessing the sustainable development of an enterprise |
The use of the break-even point model is used in management decisions and allows you to give a general description of the financial condition of the enterprise, assess the level of critical production and sales to develop a set of measures to increase financial strength.
Advantages and disadvantages of the break-even point model
Let's consider the main advantages and disadvantages of the break-even point model.
The advantages of this model are the ease of analysis and assessment of the required level of production and sales when the minimum critical level is reached. The disadvantages of the model lie in the conditions and limitations of constructing this model.
- Linearity of changes in production and sales volumes. This does not take into account various bursts and sudden changes that are often encountered in real practice. Linearity is greatly influenced by the seasonality of product release, changes in demand in the region, and the emergence of new competitors in the market. All this changes demand in the future. New technologies have a great influence on production, which also determines sales volume.
- The break-even point model is well applicable to markets with low competition and stable consumer demand for manufactured products. Globalization of markets creates more unstable demand for national products.
- The cost of raw materials during production can vary quite significantly.
- Sales volume is influenced by many factors: product quality, size of the dealer network, seasonality, marketing, etc.
- Poorly used for small businesses with fluctuating sales patterns.
Summary
The break-even point model allows you to determine the minimum acceptable limit for sales and production of products for an enterprise. This model can be well used for large enterprises with a stable sales market. Calculating the break-even point allows you to determine the safety zone - the distance of the enterprise from the critical level at which profit is zero.